


Have you ever wondered how manufacturers and engineers create flawless surfaces? Discover the legends of Surface Roughness charts and how to get the ideal texture on materials through this guide. Different topics like methods, applications, interpretation, standards and more will also be discussed in this guide that will help you to have a deeper understanding about Surface Roughness Chart. Enjoy your reading!
What is Surface Roughness?
The total space imperfections on a material’s surface, including deviances from the ideal form, are measured as surface roughness. It is an essential part of surface texture that reveals details about a surface’s topography.
Surface roughness is a common metric used by engineers and manufacturers to determine how an object will interact with its surroundings and affects things like wear, friction, and aesthetics.
Methods in measuring Surface Roughness
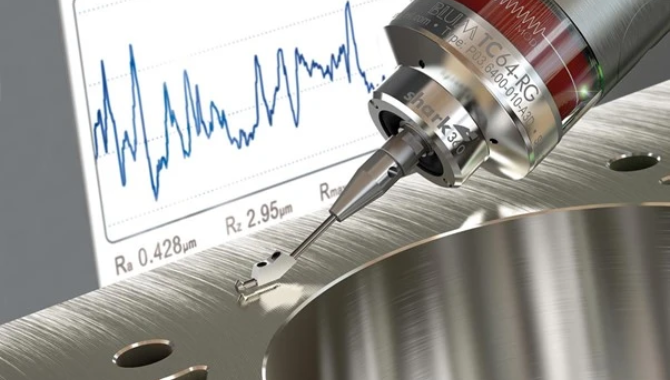
Engineers use a variety of approaches to measure surface roughness, from conventional contact methods to contemporary non-contact technology.
Stylus profilometry is one of the contact methods that uses physical probes to touch with the surface in order to record exact information. Although accurate, these techniques run the danger of changing the surface of the material. Non-contact methods, such as laser scanning or optical profilometry, minimize physical contact and offer softer evaluations. They might, however, run into difficulties, especially on reflecting surfaces.
Depending on the requirements of application, engineers must strike a careful balance between precision and possible surface impact to ensure that the beast measuring techniques are used for a given set of design and manufacturing requirements.
Surface Roughness Chart Standard
Ra | Rz | ISO 1302 | VDI 3400 | Conv. Fin | |
| μm | μinch | μm | N3-N10 | 0-45 | Mark |
0.1 | 4 | 0.4 | N3 | 0 | |
| 0.2 | 8 | 0.8 | N4 | 6 | ▼▼▼▼ |
0.4 | 16 | 1.6 | N5 | 12 | |
| 0.8 | 32 | 3.2 | N6 | 18 | |
1.6 | 63 | 6.3 | N7 | 24 | ▼▼▼ |
3.2 | 125 | 12.5 | N8 | 30 | |
| 6.3 | 250 | 25 | N9 | 36 | ▼▼ |
| 12.5 | 500 | 50 | N10 | 42 | ▼ |
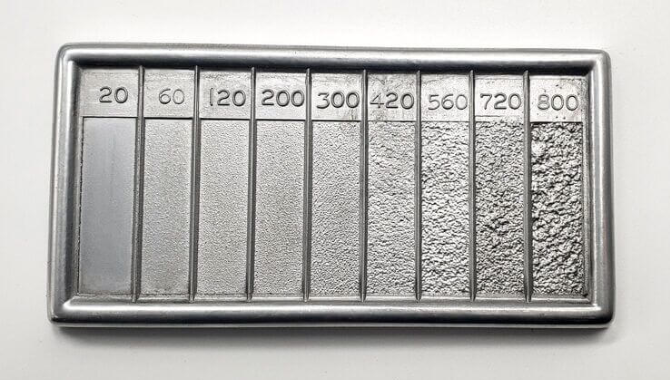
Surface Roughness Charts are essential tools in industry because they offer a consistent system for classifying and measuring surface textures. These diagrams provide as general reference points, facilitating efficient communication between engineers and producers regarding the topographical properties of various materials. Professionals that follow these guidelines guarantee a common vocabulary for assessing and attaining desirable surface finishes, which promotes accuracy and consistency across a range of production processes.
Interpretation of Surface Roughness Chart
- Average Roughness (Ra)
The arithmetic mean of the absolute roughness deviation values over the sampling length is represented by this parameter. A smoother surface is indicated by a lower Ra value.
- Average Maximum Height (Rz)
Throughout the sampling length, Rz calculates the average of the five greatest peaks and five deepest valleys. It provides information on the general differences in height on the surface.
- Root Mean Square Roughness (Rq)
Rq is a measure of the root mean square average of surface deviations and is computed as the square root of the average of the squared roughness values.
- Wavelength Symbol (λ)
This symbol aids in the comprehension of the surface texture pattern by indicating the separation between recurrent peaks or valleys in the surface profile.
- Profile Symbol (P)
The profile symbol, which affects measurement precision, represent the sampling length, or the distance over which surface roughness is assessed.
- ISO Symbols
Symbols established by ISO standards are frequently used in surface roughness charts, which aid users in understanding particular surface texture properties. In the manufacturing sector, these symbols offer a standardized language for communication.
- Graphic Representation
Users can instantly understand the type of surface roughness to the chart’s wave-like patterns that visually reflect surface attributes. The peak and valleys represent variations in the texture of the substance.

Challenges and Advances in Surface Roughness Measurement
- Challenges:
- Advances:
- Precision and Accuracy
It is still difficult to measure incredibly minute surface features with great precision and accuracy, particularly in applications where tight tolerance are crucial.
- Variability in Measurement Techniques
Different measurement methods can introduce inconsistencies that result in disparities in surface roughness ratings.
- Complex Geometry
Surface Roughness measurement on complex or curved surfaces can be difficult since conventional techniques might not yield reliable results
- Influence of Surface texture on measurement
The dependability of surface roughness data may be impacted by intrinsic texture of some materials, which can screw results.
- Environmental Conditions
Variation in temperature, humidity, and environmental cleanliness can affect the precision and repeatability of measurements.
- Non-contact Techniques
Introduction advanced non-contact techniques that provide high-resolution surface roughness measurements without coming into direct contact with the material, like laser scanning and optical profilometry.
- 3D Surface Metrology
Integration of three-dimensional surface metrology enhances measurement accuracy and enables a more thorough comprehension of surface properties.
- Machine Learning and Data analysis
Applying machine learning techniques to data analysis, improving the capacity to decipher and derive significant information from intricate surface roughness data sets.
- In-situ and Real-time monitoring
Creation of real-time and in-situ monitoring systems that allows for constant surface roughness evaluation during production processes and prompt modifications
- Improved Calibration Standards
The creation of stronger traceability and calibration standards would improve the consistency and dependability of surface roughness measurements made using various devices.
- Advancements in Nanotechnology
Application of nanotechnology to enable more accurate measurements at the nano and micro sizes, enabling a more thorough comprehension of surface characteristics.
- Portable and handheld devices
Surface roughness measurement tools that are portable and handheld and provide flexibility and user-friendliness in a range of industrial environments.
- Integration with Industry 4.0
Surface roughness measurement is integrated into Industry 4.0 frameworks, enabling smooth manufacturing system communication and guaranteeing reliable quality control.
Application of Surface Roughness Chart
Surface Roughness Charts are used in many different industries and are essential for engineering, design, manufacturing, and quality control. These charts provide guidance to the manufacturing sector on how to produce distinct surface finishes, which guarantee the desired texture for different materials.
It serves as a standard technique used by quality control to evaluate and uphold product uniformity. The chart helps engineers and designers make judgments regarding manufacturing processes and material choices, which improves the overall usability and aesthetics of goods.
Surface Roughness Charts are used by a variety of industries, including automotive engineering, medical devices, electronics, microfabrication, optics, lens production, and metalworking, to achieve exacting standards and maximize performance in their respective applications.
Conclusion
With this guide, you have gained a thorough understanding of the techniques, applications, and standards that impact modern businesses as you delve into the complex world of surface roughness. Your knowledge of surface roughness can help you in engineering, design, and manufacturing–from chart interpretation to measuring methods. In today’s diversified world, surface roughness charts are critical to accuracy, consistency, and optimal performance in a wider range of applications. The complexities of these charts are made simpler with the aid of this guide.